Each time a scan completes, Z-Sans creates a timestamped project directory inside the output directory, containing the complete asset graph and an interactive report.
Directory Structure
output/                            # Root directory (configured by output.dir / -o)
└── 20260812_231800/               # Timestamped subdirectory YYYYMMDD_HHMMSS
    ├── zsans_20260812_231800.json          # Complete asset graph
    ├── zsans_20260812_231800_assets.csv    # Asset table
    ├── zsans_20260812_231800_relations.csv # Relation table
    ├── zsans_20260812_231800.graphml       # GraphML topology
    └── zsans_20260812_231800_report.html   # Interactive HTML report
- Prefix: default
zsans, controlled by theoutput.output_prefixconfiguration - Timestamp:
%Y%m%d_%H%M%S(local time) - Directory creation timing: pre-created and cached when the engine
start()is called; plugin artifacts are written to the same directory, accessible viaengine.output_handler.run_dir
File generation is controlled by the output.formats switches (html maps to the internal report type report).
JSON Asset Graph
{prefix}_{timestamp}.json — a machine-readable format of the full asset graph; it is the data source for the Web console and project comparison.
{
  "schema_version": 2,
  "zs_version": "0.0.7",
  "stats": { "nodes": 120, "edges": 310 },
  "metrics": {
    "assets_processed": 120,
    "new_assets_found": 115,
    "depth_reached": 4,
    "errors": 0
  },
  "seeds": { "domains": ["example.com"], "ips": [], "ip_ranges": [] },
  "config_hash": "<sha256 of config>",
  "generated_at": "2026-08-12T23:18:00",
  "nodes": [
    {
      "uid": "domain:example.com",
      "type": "domain",
      "value": "example.com",
      "source": "manual",
      "depth": 0,
      "state": "scanned",
      "properties": { "domain": "example.com" }
    }
  ],
  "edges": [
    { "source": "domain:example.com", "target": "ip:93.184.216.34", "relation": "resolved" }
  ]
}
CSV Asset Table
{prefix}_{timestamp}_assets.csv — includes BOM (UTF-8-sig), so Excel opens it directly without garbled characters.
| Column | Description |
|---|---|
| ID | Asset unique identifier type:value |
| Type | domain / ip / url / port / js / cert |
| Value | Asset value |
| Depth | Discovery depth |
| Discovery Time | Discovery time %Y-%m-%d %H:%M:%S |
| State | new / scanning / scanned / eliminated / failed / excluded |
| Title/Note | url assets take the title (truncated by max_length); port assets take the service name |
| Fingerprints | Comma-joined fingerprint list for url assets |
| CMS | CMS identified by fingerprinting |
| Server | Server-side information |
CSV Relation Table
{prefix}_{timestamp}_relations.csv — 3 columns:
| Column | Description |
|---|---|
| Source Asset ID | Source asset value (UID prefix stripped) |
| Target Asset ID | Target asset value |
| Relation Type | discovered / resolved / hosted |
GraphML Topology
{prefix}_{timestamp}.graphml — a standard GraphML 1.0 directed graph, visualizable with Gephi, Cytoscape, etc.
- Node id: asset UID (
type:value) - Node attribute keys:
type,value,depth,discovery_time,state, plus url-asset-specifictitle,fingerprints,cms,server - Edge attribute key:
relation
HTML Report (recommended for viewing)
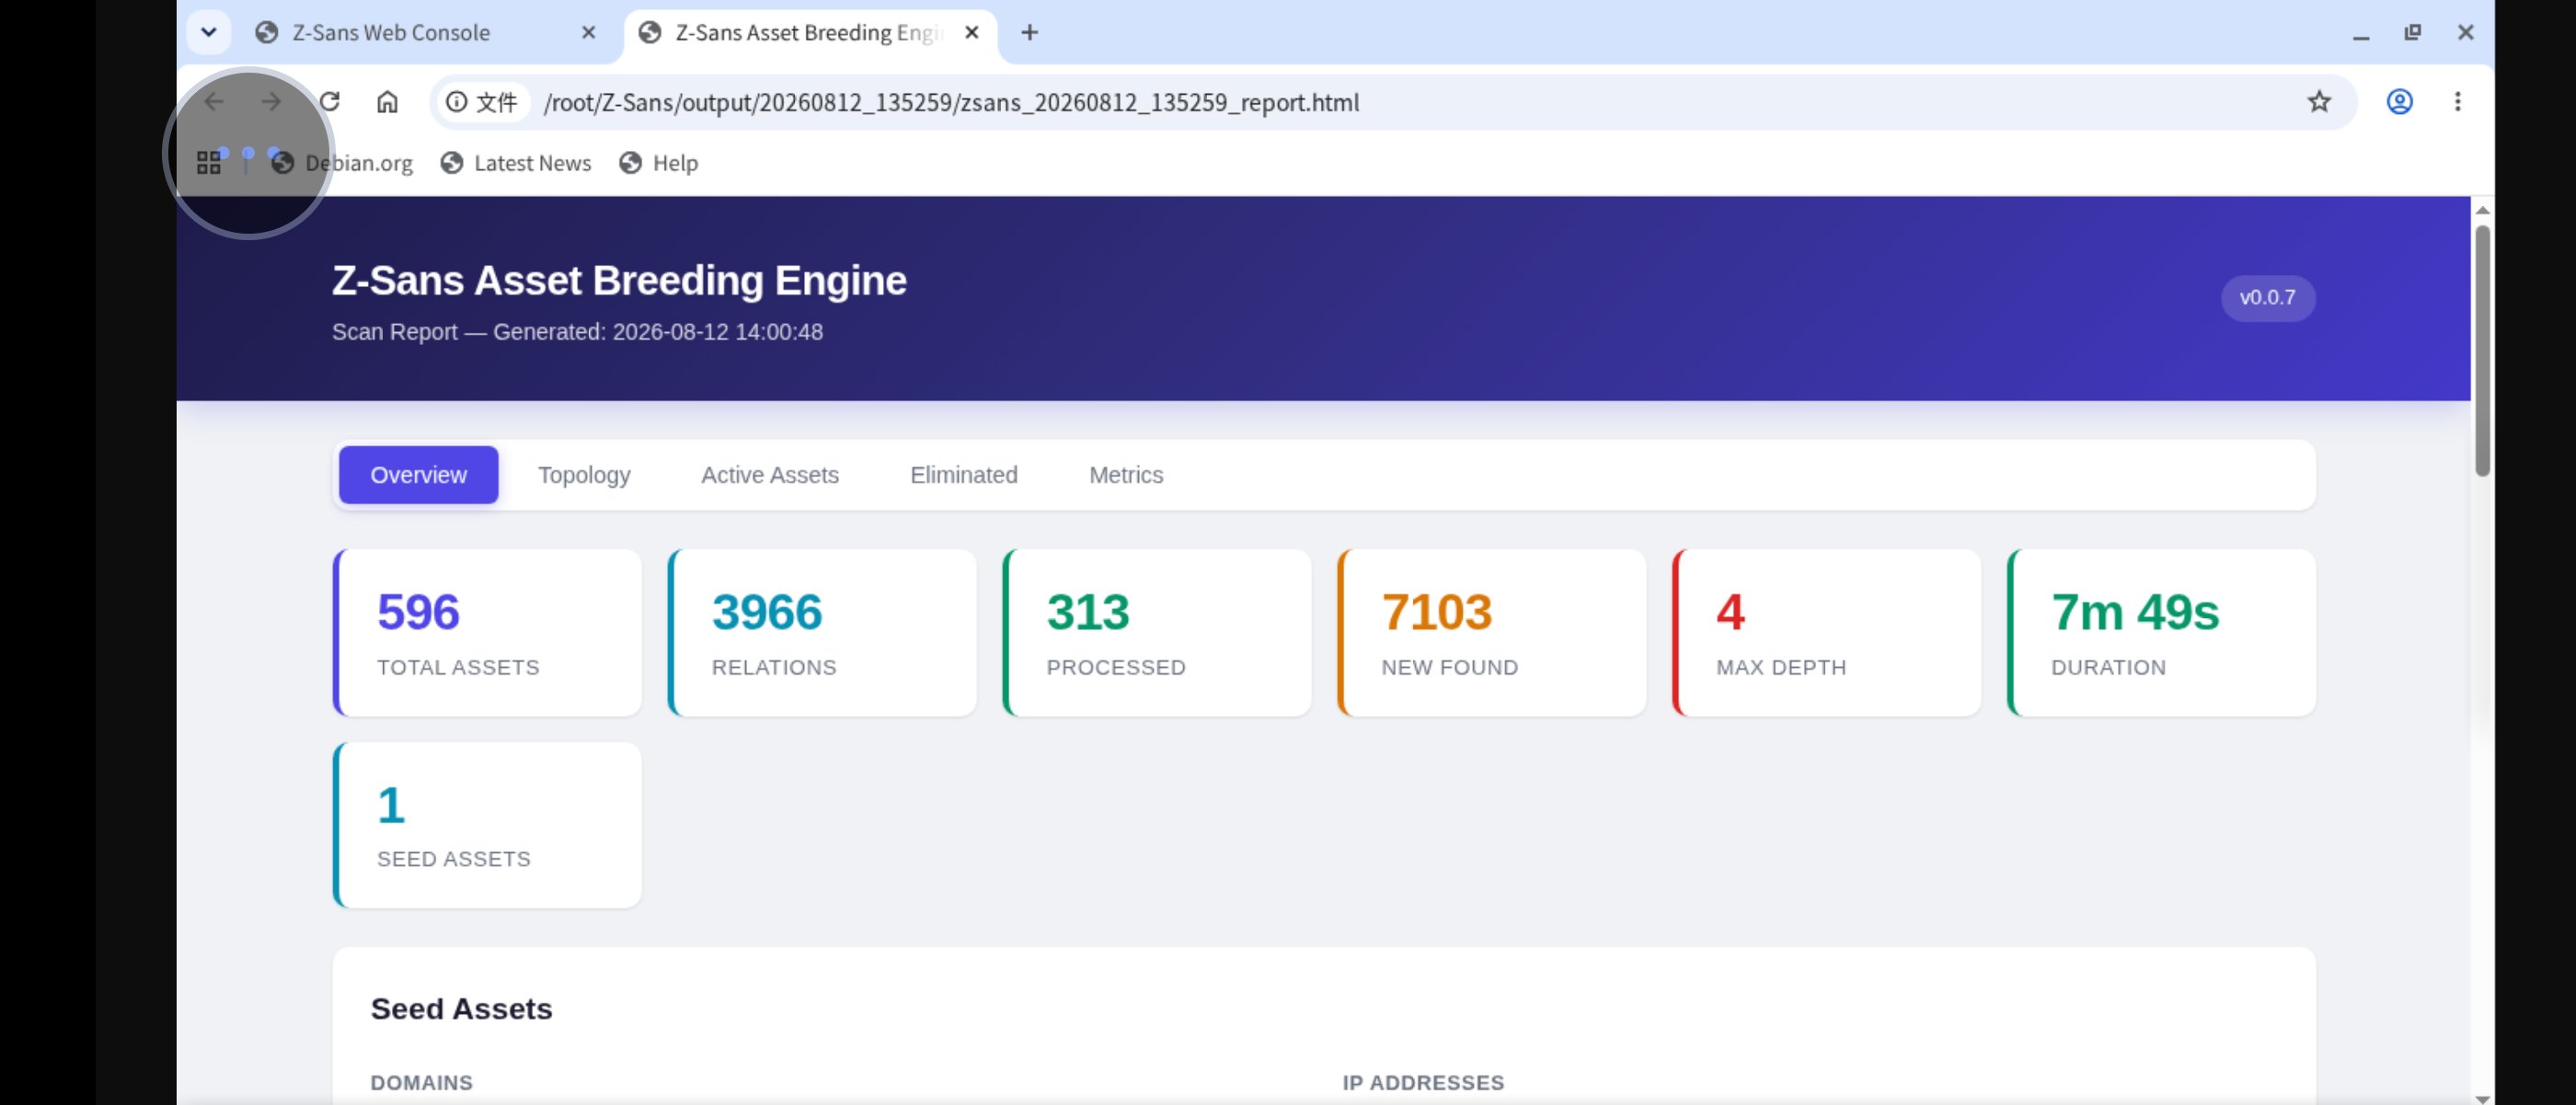
{prefix}_{timestamp}_report.html — a self-contained interactive report (inline JS/CSS, no internet required), works right after opening.
Overview Tab
- Statistics cards: total assets, total relations, processed, newly discovered, max depth, elapsed time, seed count
- Seed asset list (domains + IPs)
- Top Hosts: top 15 by descending degree
- Asset type distribution: horizontal bar chart + donut chart
Topology Tab
- Native Canvas force-directed topology graph (no third-party graph library)
- When nodes > 300, truncated to 300 by degree
- Nodes colored by type, radius grows with degree, labels shown when zoom > 1.6
- Drag to pan, wheel / pinch zoom (0.05~8x), auto fit
Active Assets Tab
Asset table (Type/Value/Depth/Discovery Time/State/Title-Note/Fingerprints/CMS/Server) + live filtering.
Excluded Assets Tab
Table of excluded assets + reasons; requires output.keep_eliminated_assets: true (on by default) to have data.
Metrics Tab
- Full
engine.metricskey-value pairs - Port distribution (service / count)
- Exclusion reason statistics (reason / count)
Filtering and Search
- Search box: case-insensitive substring match on the whole row text
- Three dropdown filters: Type, State, Depth
- Live-updating count:
Showing N assets (filtered)
The report language follows the i18n configuration (zh prefix → lang="zh-CN").
Sample HTML Report
Checkpoint File
<output_dir>/checkpoint.json (default location) is used for resumable scanning:
- Save triggers: every
checkpoint.interval(default 50) processed assets, and onstop() - Atomic write: first write
.tmp→flush+fsync→os.replace, to prevent corruption on interruption - Contents: seeds, metrics, all nodes, edge triples, pending queue